Inflation
The Consumer Price Index that the Reserve Bank of Australia use to index inflation is published quarterly, one month after the end of each quarter.
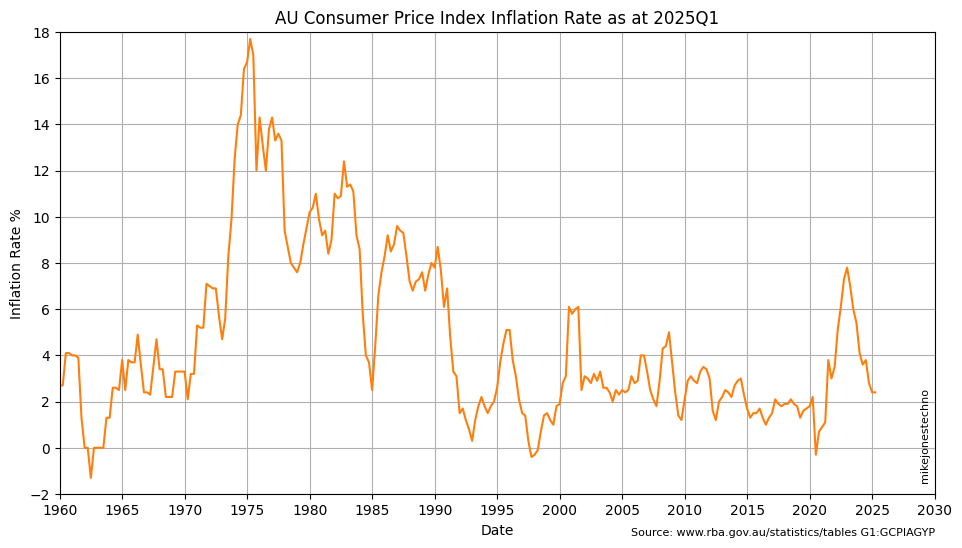
Inflation rocketed through the roof in the 1970s peaking at 18% in 1975.
Inflation remained highly volatile but eventually stabilized through the 1990s, and was trending slightly down through the 2000s until the spike back up to 8% at the end of 2022.

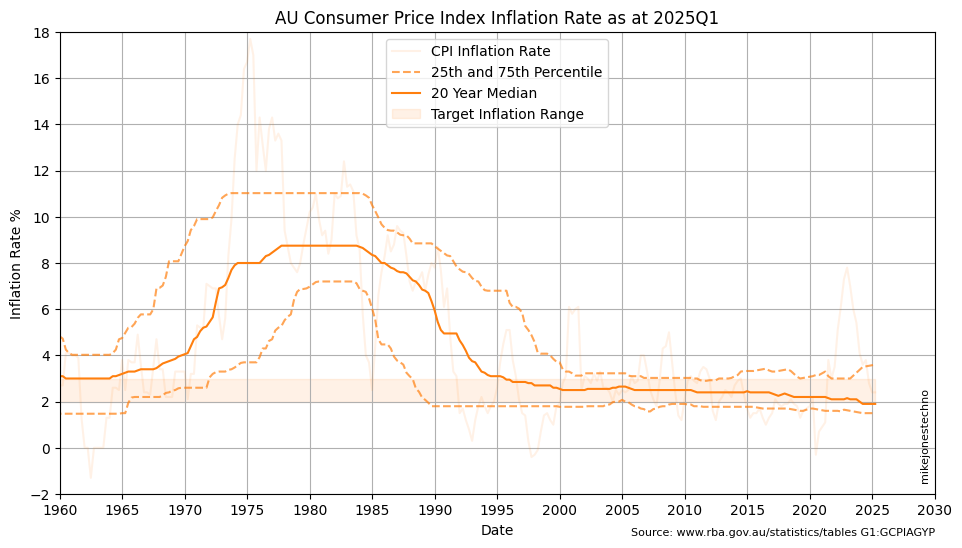
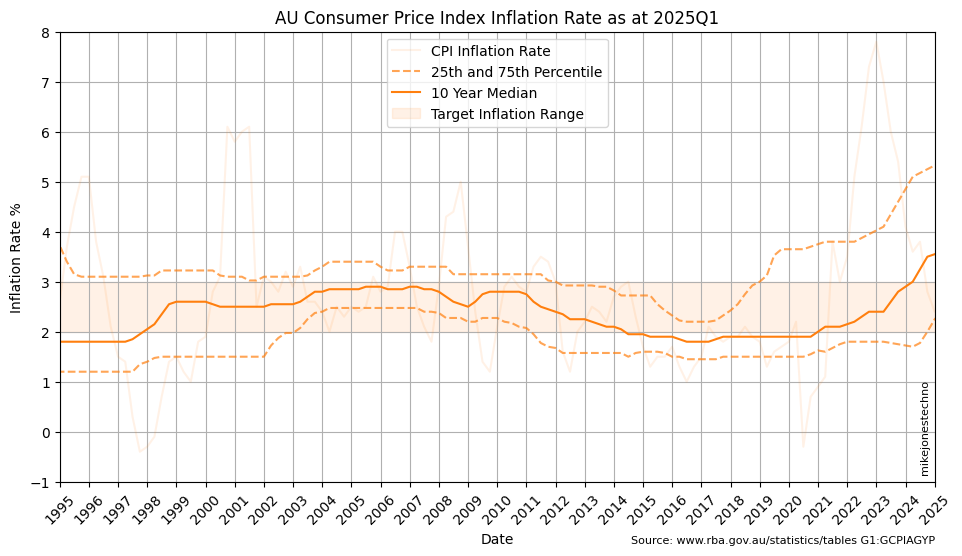
Calculating the 25th and 75th percentile over a multi year time horizon helps smooth out the anomolies and visualize the lower and upper long term trends.

Over the last 5 years the median (50th percetile) inflation rate is 3.70%; The mean (average) inflation rate is 3.83%.
Over the last 30 years the median (50th percetile) inflation rate is 2.50%; The mean (average) inflation rate is 2.71%.
| Years | 25th percentile | 50th percentile | 75th percentile | mean |
|---|---|---|---|---|
| 1 | 2.40 | 2.60 | 3.05 | 2.85 |
| 5 | 2.40 | 3.70 | 5.55 | 3.83 |
| 10 | 1.50 | 1.90 | 3.65 | 2.76 |
| 20 | 1.77 | 2.40 | 3.32 | 2.75 |
| 30 | 1.70 | 2.50 | 3.30 | 2.71 |

The chart shows inflation stayed close to the RBA target inflation rate of 2 to 3 percent for over twenty five years.
ℹ The data suggests high confidence using a baseline inflation of 2.5% with some uncertainty or risk that inflation could peak higher.